The internet of things (IoT)-based Water Distribution and Management
Goals of Water Distribution and Management Solution
- To save Dhaka city from the current ailing water infrastructure and mitigate environmental risks associated with it, as the depletion of natural resources and pollution are rising.
- To incorporate a modern, technology-based water infrastructure in Dhaka city, that will cater to the need of a smart city, thereby improving the quality of life for future generations.
Scope of this Solution
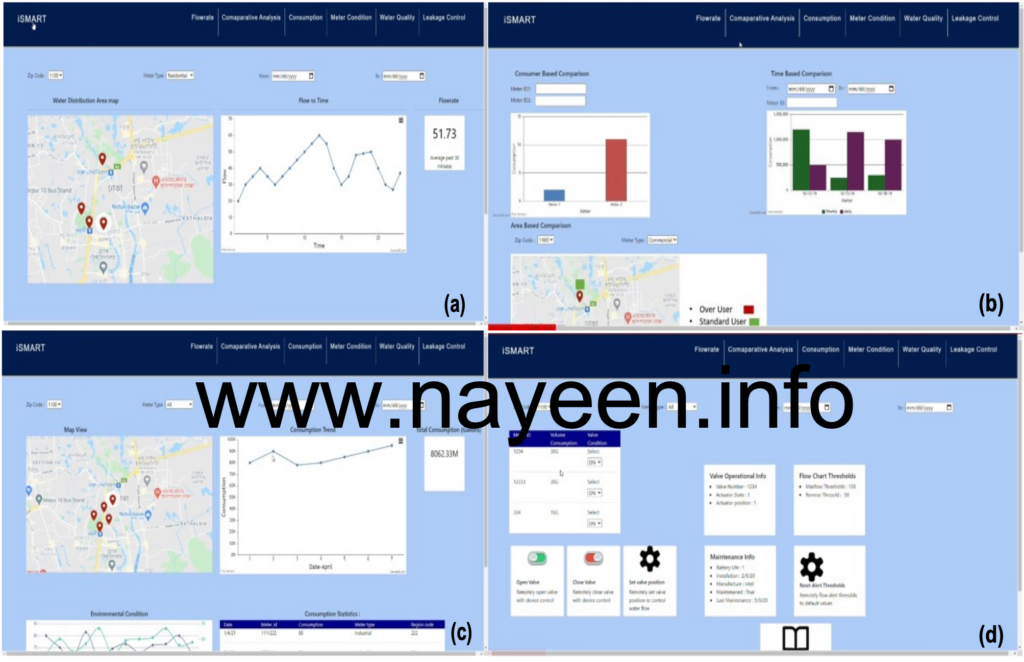
This Solution has designed and constructed a smart water flowmeter as a POC (Proof of Concept) with remote flow ON/OFF control and connected it to a real-time dashboard. The developed dashboard will show flow rate analysis, consumption analytics, comparative analysis, real time meter condition,
water quality, and leakage control modules. A mobile application has also been designed which can work as a citizen access and engagement tool to promote the responsible use of water. Watch the POC video demonstration of the smart meter system and the dashboard below.
Brief technical description of the operation of the smart meter and associated Data analytics infrastructure.
The Solution IoT-based Sensing and Multiscale Analytics for wateR Tracking (iSMART) technological solution will consist of 5 (five) layers as shown schematically below image.
- The first layer is a physical layer that includes mechanical components e.g., pumps, valves, and water meters.
- The second layer includes the sensors and control. This layer senses the changes in water flow and quality at various points and converts the signal from hydraulic to electronic (at the sensing locations) or vice versa (at the dashboard). It includes sensors, actuators, and remote pilots for automatic control valves.
- The third layer is data collection, storage, and transmission of collected data from the sensors. This includes components like Advanced Metering Infrastructure (AMI), wireless network access technology, Supervisory control and data acquisition (SCADA), and data loggers.
- The fourth layer is data management and display. this accounts for Human-Machine Interface (HMI), and IT interface and shows complete data of the network.
- The fifth and final layer accounts for data fusion and analysis including data handling, hydraulic modeling systems, network infrastructure monitoring, smart pressure management, smart pumping or energy optimization systems, and more. Decision Support Systems also fall into this layer.
The incorporation of the fourth and fifth layers are core components for smart water solutions. The fifth component that deals with big data analytics and artificial intelligence for water management has the largest scope of development and is most important in a smart water system.
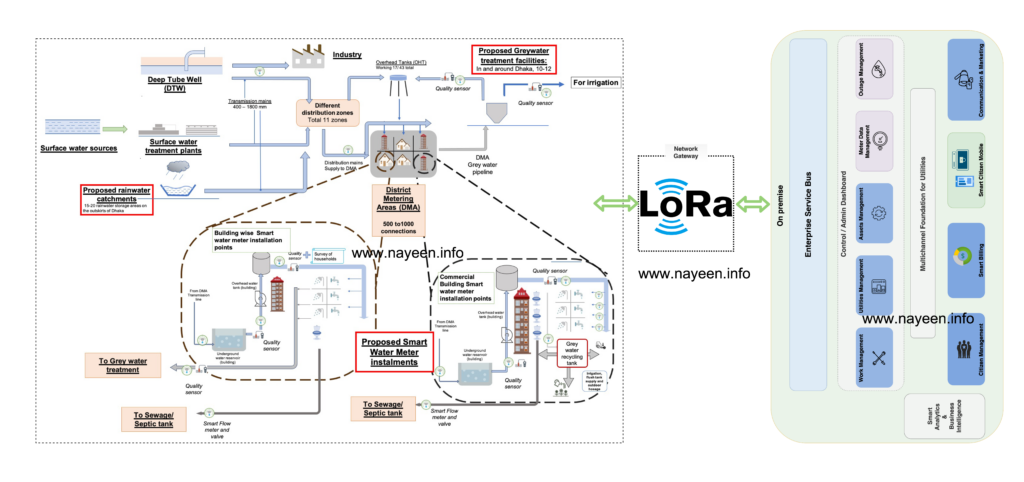
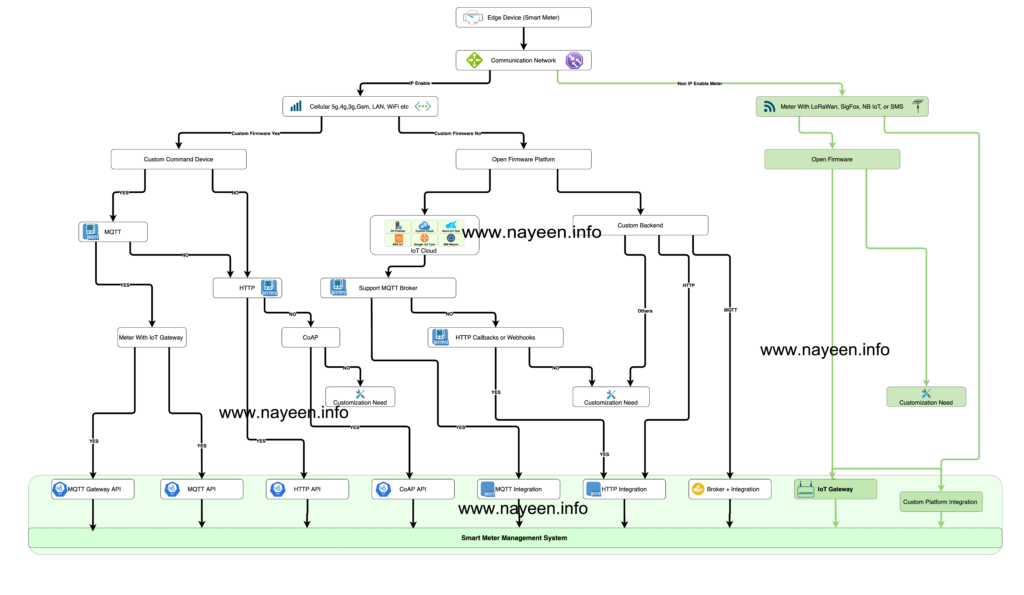
Choice of Wireless Communication Network
For a city like Dhaka with old infrastructure and high population density, we propose LoRaWAN as the communication network. LoRaWAN technology has low power consumption, a high communication range of about 5-10 KM, and a low data rate, which is an excellent fit for IoT devices since these are battery-powered, thus requiring low power consumption. The electronic components can be placed far from each other as there are multiple gateways, which ensure the reliability of wireless data transmission
and interference resistance. This network allows unlimited nodes without rebuilding the wireless infrastructure. It also has no monthly subscription unlike LTE, GSM, NB-IoT, making LoRaWAN technology a low cost one.
With the penetration of LPWAN (Low power wide area network) technologies
including LoRa and Sigfox in the water industry, remote monitoring for precipitation,
groundwater, surface runoff, water quality, and wastewater volumes is both low-cost
and in real-time, with little operator interference.
Ownership models shall also change in IoT enabled AMR system, based on Network
as a service model. As the system shall be maintained via cloud most of the components
like modeling software, information storage, operating system, networking, server
installation and maintenance costs by service provider can be on a subscription-based
model (NaaS or SaaS) which is comparatively efficient compared to traditional system
where all responsibility lies with utility.
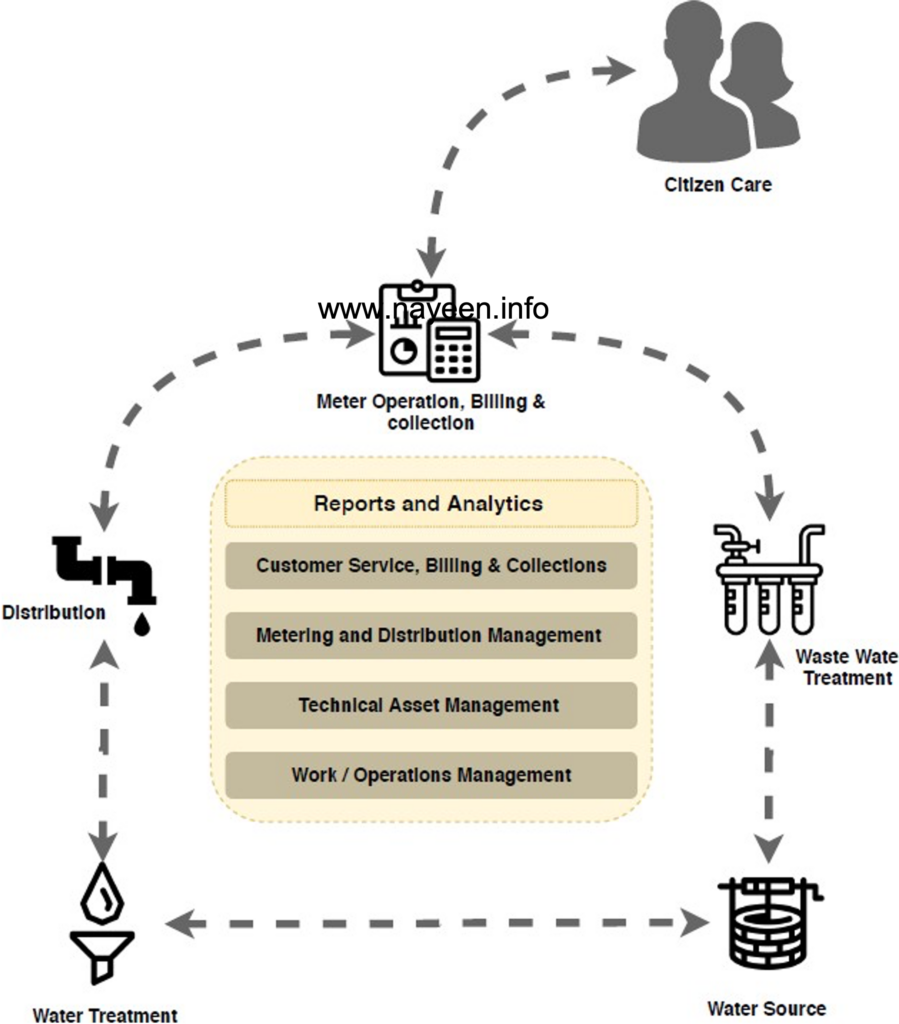
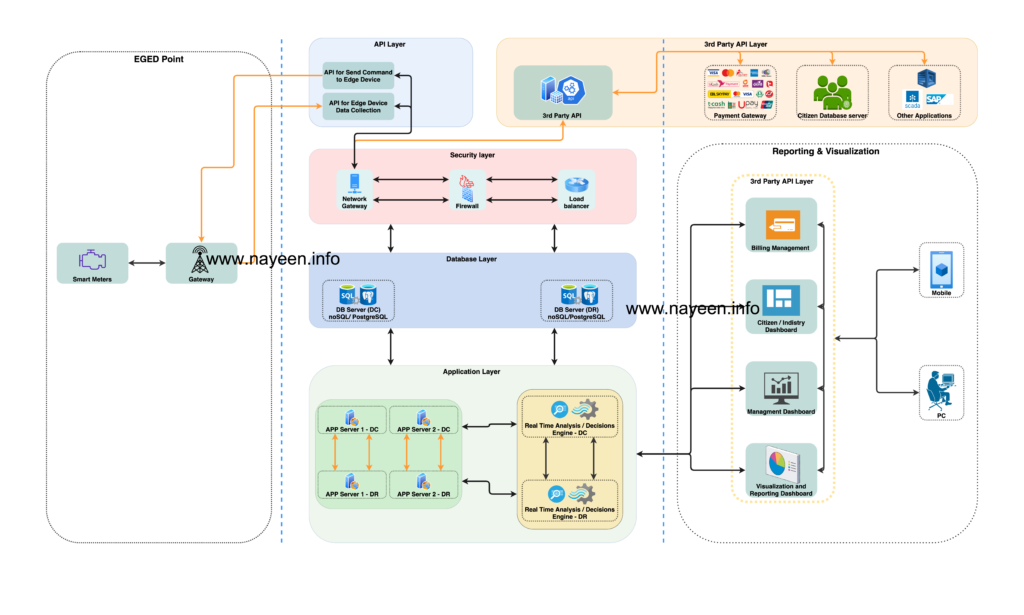
Data management, modeling and visualization
The intelligent water analytics tool has two primary layers: The infrastructure layer and the Visualization layer.
The infrastructure layer consists of an Application Programming Interface (API) layer, Security layer, Database layer, and Application layer.
- API layer sends and receives data from the communication gateways and also connects the system to third party applications.
- Security layer consists of Network Getaways, Firewalls, and Load balancers. Network Gateways which communicate with the internal and external networks. Firewalls allow applying customized rules and policies on incoming and outgoing connections to ensure proper security. Load Balancers distribute the Application and Database server traffic load, based on accepted requests and distributes different User, IoT Client, Gateway, or any third party Application traffic in a proper manner to the proper server, and maintains the most reliable application service runtime.
- Database layer has repositories and data sources, that can be used for data analysis, presentation and reporting.
- Application layer has app servers and real time analysis and/or decisions engine. It uses disruptive technologies like Big Data Analysis, artificial intelligence and Machine Learning to produce reports, creates patterns to identify anomalies, makes complex time sensitive predictions based on data and mathematical modeling enabling real time decision making.
The Visualization layer presents the output generated by application layer to the end user through dashboards on web portals. A smart water management system can have the following the following modules:
- Real time performance of the drinking water distribution network. This uses flowrate, pressure, pH and other chemical property indicators to calibrate pipeline flow, pressure, monitor water quality and ensure real time leak identification. These help in reducing water losses in the distribution pipeline.
- Predictive and optimized real time management of drinking water systems. This module monitors water consumption for individual household and looks for spikes in usage to identify leaks, overflows and employs a prepaid or tiered billing system to induce responsible consumption of water. Finally, optimize the management of drinking water production and rationalize operational costs.
- Early warning and dynamic management of storm water systems and efficient drainage. This module uses predictive technologies to protect consumers from flood risks, optimize he economic performance of the wastewater treatment systems and minimize environmental pollution risks.
Citizen Engagement Tool – Mobile Application
The water innovation challenge also requires the development of a water tool analytics platform for citizens through which they would be able to pay their bills from home and stay aware of their water consumption patterns. It should also have personalized features and promotions to ensure greater user engagement and identify good performers in terms of water usage so that WASA and other government departments can recognize them leading to an overall reduction in water footprint.
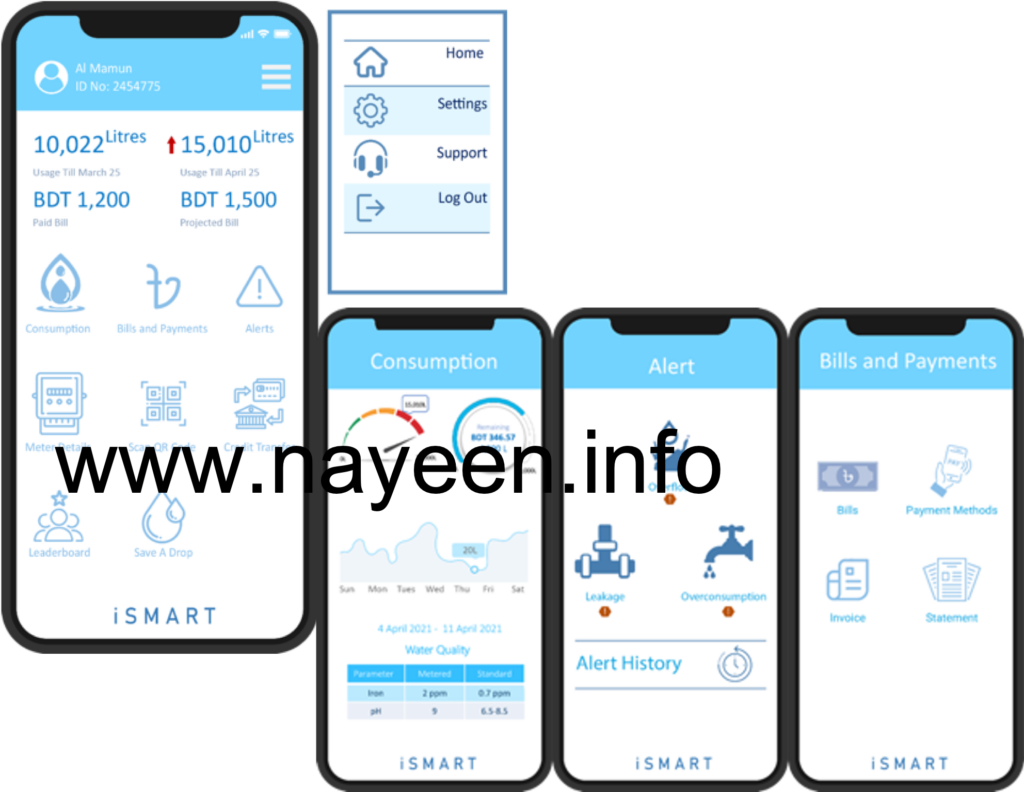
This is the primary design for the User interface of our proposed iSMART mobile app. On the home page, the overall summary of used and projected water footprint along with the bills will be shown, there will also be clickable menu items like consumption, bills and payment methods, alerts, meter details, and some very interesting ones like ‘Save a Drop’, ‘Leaderboard’ and ‘(Water) credit transfer’ on the homepage.
Clicking on the ‘Consumption’ icon will lead to the ‘Details’ page which shows the users consumption profile and credit balance. The users can check their consumption rate in a time series curve, where the time duration can be adjusted to days, weeks or even months. They can also check the water quality parameters like iron concentration and pH in the water supply and compare this to the standard value.
The ‘Bills and Payment Methods’ page will show current and due bills, citizens can pay bills using various payment methods including online and mobile banking options and other financial services. They can also update and download invoices and check statements.
We have ‘Alerts’ for users who frequently suffer from water overflow and loss due to mismanagement of turning off the overhead water reservoir’s electric pump. The ‘Alerts’ feature can generate an immediate warning in case of an overflow and notify the user instantaneously. Other useful alerts like leakage alerts and overconsumption alerts will also help to conserve water. Users can check all of these alerts and their respective occurrence time in the ‘Alert History’ section.
‘Leaderboard’ acknowledges the responsible water users of the community, Authority can offer different promising rewards such as reduced billing for a certain amount of water in the following month, free credit, lucrative subscription packages, etc to users of a locality who have saved water and reached the top of the leaderboard in a particular month.
We believe that it is a crucial duty of each citizen to build fair and affordable access to safe and adequate amounts of water for our increasing population. That is the idea behind “Save a drop”. Using this feature a user can see the number of needy families in their vicinity and they can help via their own efficient water usage. This feature is not limited to moral benefits. By the ‘Credit Transfer’ option, one user can send the surplus he or she has saved from their rational water use to near and dear ones who are currently living in crisis affected areas; the monetary equivalent can be donated to charities of the users’ choice.
There can be a ‘Are you saving enough?’ segment providing a comparison of one’s own water consumption to that of the average household in the same neighborhood. There can be awareness messages showing that a similar household in the neighborhood has lower water consumption compared to their own previous usage. This section can also provide tips to achieve similar level of water savings for this user.
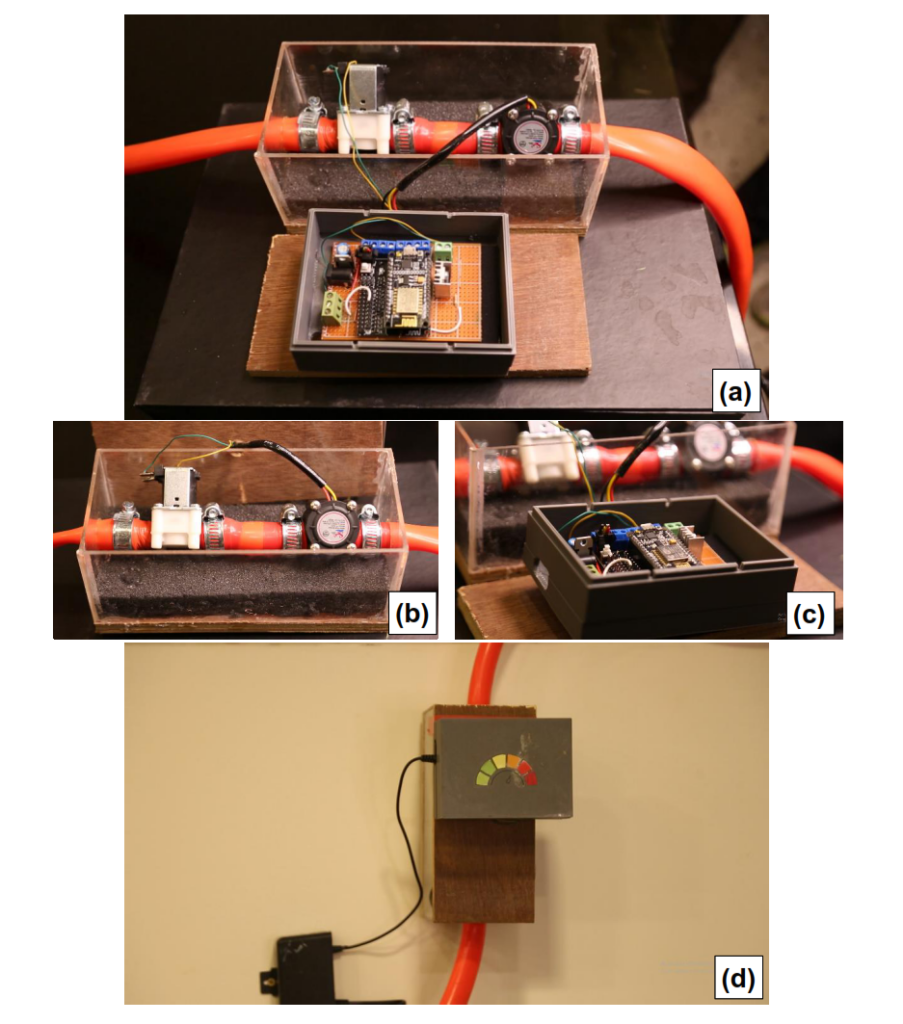
POC Meter Construction
The circuit for the sensor was built on a Node MCU ESP8266. It can be connected to the wifi network with a standard 802.11 b/g/n. This board consists of the ESP-8266 32-bit microcontroller and the 2.4 GHz Band radio frequency module. The main specifications are 80 MHz speed, 4 MB Flash memory and 64 KB SRAM memory, 11 digital pins and 1 analog pin, and a 3.3 V power supply. The schematic diagram of the circuit is shown in the below Figure.
This electronic sensor was connected to a valve and a flowmeter which would respond to requests from the remote dashboard.